U.S. oil stocks are dwindling, illuminating emerging supply risks and market dynamics amidst ongoing geopolitical conflicts.
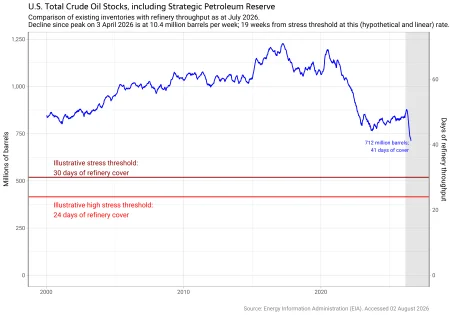
The ongoing fuel crisis, heavily influenced by geopolitical events, is attracting significant attention. The war in Iran poses threats to oil transit routes through the Red Sea, while the ongoing conflict in Ukraine continues to undermine Russia’s oil refining capabilities. This complex backdrop raises questions about the future of oil availability in the United States, particularly as crude oil stocks are reported to be at historic lows.
Declining Stocks: The State of U.S. Crude Oil Reserves
Recent reports indicate that U.S. crude oil stocks, including those stored in the Strategic Petroleum Reserve (SPR), have reached modern record lows. However, industry experts often hesitate to contextualize these figures within the framework of absolute quantities remaining. Instead, they typically draw comparisons with seasonal or historical lows, leaving a critical gap in understanding the current reserves. This omission can lead to misconceptions about the true state of U.S. oil availability.
There’s a hidden layer of complexity behind how much oil the U.S. has at its disposal. While precise measurements are challenging, estimates suggest that sizeable amounts are necessary just to maintain operational integrity across storage and distribution systems. Consequently, this adds a layer of uncertainty regarding how much spare capacity is genuinely available for consumption.
To highlight these realities, I constructed a chart that illustrates the depletion of U.S. crude oil stocks over time. By setting arbitrary benchmarks based on refinery throughput rates, it appears that the current depletion rate could lead to critical limits being reached in roughly 19 weeks if no interventions occur.
Despite this potential for depletion, it’s essential to recognize that the U.S. has ample oil resources. However, markets appear to bet on imminent improvements before reaching dangerously low stock levels. Presently, oil prices hover around $90 per barrel, likely influenced by market sentiments that discount the prospect of a long-term disruption in supply routes through critical areas like the Strait of Hormuz.
That said, the forecast of 19 weeks should not be taken literally. Before stocks reach alarmingly low thresholds, we'd expect significant economic adjustments and shifts in political dynamics. Measures to keep retail prices in check would likely be overwhelmed, resulting in reduced demand and fostering pressure on the U.S. to restore access to vital transit routes in the Persian Gulf and Red Sea. Essentially, this window indicates that some change will have to occur soon to avert a broader crisis.
Assessing the Strategic Petroleum Reserve and Refined Products
Further analysis reveals the importance of the SPR and provides a broader perspective by examining specific refined products as well. By breaking down total oil stocks into those in the SPR and conventional sources, along with monitoring critical refined fuel categories like gasoline and diesel, we can paint a clearer picture of the actual fuel reserves.
This refined view not only highlights the stocks available in the SPR but also helps frame the conversation around gasoline and distillate supplies. While total crude oil stocks are decreasing, understanding the variance among different types of petroleum products gives insight into potential market reactions and consumer pricing impacts.
Staying Informed Through Data
The statistics and data visualizations presented here derive from the U.S. Energy Information Administration, demonstrating an evolving profile of U.S. fuel stocks. The need for precise tracking and analysis has never been more paramount given the geopolitical landscape.
The ongoing need for adaptive strategies means data formats and plotting methodologies must develop alongside market conditions. For example, I’ve utilized tools from the Tidyverse in R to automate processes and maintain accurate visualizations of stock levels over time, considering variations in refinery throughput and other operational metrics.
library(tidyverse)
library(readxl)
library(scales)
library(glue)

fn <- "us-petrol-status-weekly.xls"
download.file(
"https://ir.eia.gov/wpsr/psw01.xls",
fn,
mode = "wb"
)

us_stocks <- read_excel(fn, sheet = "Data 1", skip = 2) |>
  rename(
    crude = `Weekly U.S. Ending Stocks of Crude Oil (Thousand Barrels)`,
    crude_spr = `Weekly U.S. Ending Stocks of Crude Oil in SPR (Thousand Barrels)`,
    gasoline = `Weekly U.S. Ending Stocks of Total Gasoline (Thousand Barrels)`,
    diesel = `Weekly U.S. Ending Stocks of Distillate Fuel Oil (Thousand Barrels)`,
    date = Date
)

# Plotting logic can be added here
With accessible data visualizations and ongoing analysis, stakeholders can better navigate the potential volatility in oil supplies. While the immediate outlook remains uncertain, one thing is clear: the interplay between geopolitical factors and domestic oil reserves will continue to shape market conditions in the months ahead.
For continuous updates and more detailed insights, you can visit the dedicated fuel crisis monitoring page.
Discussion
Sign in to join the discussion.