Geocomputation in R is evolving. Insights from UseR! 2026 highlight both the progress and the challenges in the spatial analysis community.
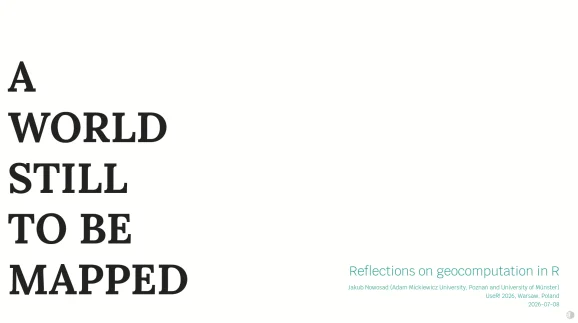
At UseR! 2026 in Warsaw, I participated in an engaging workshop focused on Geocomputation with R on July 6, 2026, and presented a keynote titled A World Still to Be Mapped: Reflections on Geocomputation in R on July 8, 2026. These sessions were great platforms to examine the current capabilities of the R spatial ecosystem, its strengths and weaknesses, as well as the crucial work that remains ahead.
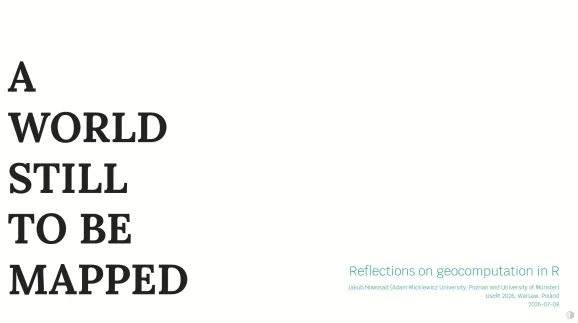
Keynote slides: https://jakubnowosad.com/user2026/
Workshop materials: https://github.com/geocompx/user26
Workshop Overview
The workshop, led by Jannes Muenchow and based on the latest edition of Geocomputation with R, focused on essential components of spatial analysis in R. Topics included handling vector data using the sf package, raster data management with the terra package, and spatial data visualization techniques through the tmap package. My specific focus was the visualization aspect, where I illustrated the core components of effective mapping workflows and demonstrated how maps can enhance our understanding of geographic data while communicating analysis results.
This set of tools forms a mature, interoperable ecosystem within R. They enable not just the import and manipulation of geographic data, but also encompass R's broader capabilities in data processing and statistical analysis. The workshop blended presentations with live coding and hands-on exercises, providing participants with a valuable introduction to these tools. Anyone interested can find the exercises within the workshop materials. The practical approach adopted helps demystify R's spatial capabilities, allowing participants to engage actively rather than passively absorbing information.
Keynote Insights
During my talk at UseR! 2026, I approached geocomputation through my perspective as a computational geographer. Geography is more than just mapping coordinates; it's fundamentally about questioning the dynamics of geographic phenomena: what, where, why, and how these patterns evolve over time. Addressing these inquiries demands a combination of spatial data analysis, statistical modeling, and visualization techniques.
Reflecting on the progress of the R spatial ecosystem, it's clear that R has matured into a powerful tool for spatial analysis. Its growth encompasses features for vector and raster data management, visualization, reproducibility, and integration with larger geospatial infrastructures. However, many critical gaps aren't merely technical. The community faces challenges beyond creating superior packages, including inadequate validation practices and misleading maps. Trustworthy predictions and visual representations shouldn't just be aspirational; they must become standard. This is more significant than it looks, and it calls for a shift in how developers approach the quality of their outputs.
In this context, I discussed the importance of methods like prediction-domain adaptive evaluation within spatial machine learning. I highlighted that selecting appropriate color palettes and projections in spatial visualization is not just an aesthetic choice; it's essential for accurate communication of information. Poor color choices can mislead users, skew interpretations, and dilute the message intended by the data.
Ultimately, the future of geocomputation within R hinges as much on the richness of its community as on technological advancements. The R spatial environment excels in scientific rigor and reproducible workflows, but these attributes depend fundamentally on an active community of users and developers. This isn't just about coding; it's about sharing knowledge and mentoring newcomers to improve collective competence. If you're working in this space, the ability to communicate findings effectively is as vital as the analysis itself. Moving ahead, we must nurture tool development while also fostering the individuals who create and maintain software, share knowledge, and apply methodologies to solve real-world challenges.
Implications and Future Outlook
The conversations sparked at UseR! 2026 reflect broader trends in geocomputation and spatial analysis. The growing importance of mapping in social sciences, environmental studies, and urban planning underlines the need for accessible and reliable geospatial tools. As the demand for precise spatial analysis continues to rise, so does the responsibility of the community to uphold standards that ensure reliability.
While R continues to evolve with updates that enhance its spatial capabilities, practitioners can't overlook the significance of community engagement. A thriving user base fosters innovation and accelerates the pace at which practical solutions are developed. This collaboration is essential, considering that many emerging challenges in geography, such as the impacts of climate change or urbanization, require interdisciplinary approaches that blend technology with domain expertise. And yet, there's a sense of urgency—without proactive involvement, the community may fall short of addressing these critical issues effectively.
The implications are clear: fostering collaboration and prioritizing data integrity will define the next chapter for geocomputation in R. As practitioners, developers, and educators, our collective actions will shape not just the tools available but the quality of insights drawn from them. The expectation is not merely for improved software but for a responsible approach that values transparency and reproducibility. (and this is the part most people overlook) The future of spatial analysis will rely just as much on the strength of interpersonal connections as on any algorithm or system.
R-bloggers.com offers daily e-mail updates about R news and tutorials about learning R and many other topics. Click here if you're looking to post or find an R/data-science job.
Discussion
Sign in to join the discussion.