This analysis applies Kalman filtering techniques to compare financial trends in Gold and Bitcoin, focusing on signal extraction and divergence detection.
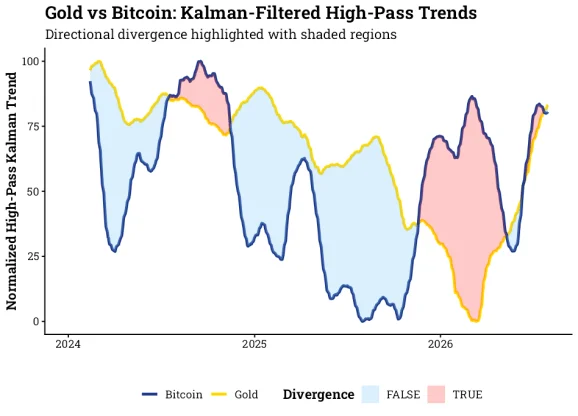
Recent advancements in data analysis are opening intriguing paths for comparative financial studies, particularly between traditional assets like Gold and digital currencies such as Bitcoin. Drawing inspiration from techniques designed for biomechanics, we can leverage a Kalman filtering approach to extract meaningful trends from the inherent noise in financial time-series data. This intersection of finance and engineering stresses an increasingly data-driven approach to understanding asset behavior.
Adapting Techniques for Financial Analysis
The challenge with financial data mirrors that of measuring joint angles in dynamic sports: both are fraught with noise and drift, complicating direct comparisons. In finance, the volatility of prices can mask underlying trends, leading to misinterpretation of asset performance. Therefore, by adapting a structured four-stage pipeline from biomechanics, we can filter out the noise and accurately extract trends from Gold and Bitcoin returns. The precision of this filtering process is essential when investors rely on accurate data to make informed decisions.
The Four-Stage Pipeline
Our approach consists of:
- Indirect Kalman Filtering (IKF): This first stage hones in on identifying latent trends within the log returns of financial assets. By mechanics adopted from Kalman filtering techniques, the state and observation equations utilized are crucial in isolating the true signal from random fluctuations in the data. This filtering process is akin to fine-tuning a musical instrument, where only the most relevant sounds – or, in our case, trends – are brought to the forefront.
- Drift Mitigation via High-Pass Filtering: In this phase, we remove low-frequency bias to ensure long-term trends don’t obscure short-term dynamics. This is particularly important in markets that react rapidly to events, such as economic news or geopolitical tensions. By refining our understanding of immediate market reactions, we can provide a clearer picture of how quickly and efficiently the market adapts to various stimuli.
- Range Normalization: This stage maps the filtered returns onto a uniform scale, allowing for a direct comparison between Gold and Bitcoin by adjusting values to a 0-100 spectrum. Such normalization is critical for visual analysis and comparative assessments. It turns raw data points into a comparable format, making it easier for analysts and investors to interpret findings at a glance.
- Relative Notation (Directional Divergence): Lastly, we implement a divergence indicator to highlight instances when Gold and Bitcoin trend in opposite directions. This helps identify market discrepancies and potential investment opportunities. After all, trends that diverge can signal shifts in market sentiment, offering strategic insights to savvy investors looking to capitalize on short-term fluctuations.
Importance of the Pipeline
- For sports biomechanics, the original pipeline provided accurate tracking of joint angles, fostering reliable insights into athlete performance. In practice, such accuracy can differentiate between a winning and losing performance, reinforcing the need for precision.
- In finance, its adaptation enhances the reliability of comparative trend analysis, yielding greater insights into asset behavior. This reliability is paramount for institutions managing large portfolios where slight deviations in strategy can lead to substantial financial impacts.
- The modularity of this framework is key; each component—from IKF to divergence detection—serves a distinct function that strengthens overall analysis. This modularity allows analysts to adapt each stage individually depending on the data sets at hand, which means they can fine-tune their approach based on specific market conditions or asset types.
Implementing the Pipeline with R
To ensure reproducibility, we utilize several R packages tailored for financial data manipulation and analysis:
- tidyverse: This suite of packages is indispensable for data wrangling, allowing for clean transformations of raw data into structured formats. A well-structured dataset is the bedrock of any meaningful analysis.
- tidyquant: It facilitates the scraping and transformation of financial data, bridging the gap between tidyverse and financial APIs. The ease of pulling information into a tidy format can save significant time in data preparation.
- KFAS: Specialized in applying state-space modeling and Kalman filtering, it’s essential for separating trends from noise. This package brings sophisticated modeling into the reach of those previously intimidated by its complexity.
- zoo: This package supports rolling window operations, crucial for applying high-pass filters effectively. Time series analysis often demands temporal resolution; this package addresses that need directly.
- scales: Assists with normalization and rescaling, enabling easy asset comparisons within a uniform range. Data interpretation is significantly enhanced when values are on a consistent scale.
- ggbraid: Used for visualizing divergence between asset trends, it provides an intuitive graphical representation of market behavior. Visualization can often convey trends more readily than numbers alone.
- ggplot2: Essential for crafting comprehensive visualizations of monitored financial trends. The impact of a well-illustrated chart can't be overstated in conveying insights.
Here's a streamlined example of how this pipeline can be set up using R:
library(tidyverse)
library(tidyquant)
library(KFAS)
library(ggbraid)

# Step 1: Fetching and calculating log returns for Gold and Bitcoin
gold <- tq_get("GC=F", from = "2024-01-01") %>%
  tq_transmute(select = close, mutate_fun = periodReturn, period = "daily", type = "log")
btc <- tq_get("BTC-USD", from = "2024-01-01") %>%
  tq_transmute(select = close, mutate_fun = periodReturn, period = "daily", type = "log")

# Step 2: Kalman Filter modeling for both assets
model_gold <- SSModel(gold$ret_gold ~ SSMtrend(1, Q = list(NA)), H = NA)
model_btc <- SSModel(btc$ret_btc ~ SSMtrend(1, Q = list(NA)), H = NA)
fit_gold <- fitSSM(model_gold, inits = c(log(var(gold$ret_gold)), log(var(gold$ret_gold))))
fit_btc <- fitSSM(model_btc, inits = c(log(var(btc$ret_btc)), log(var(btc$ret_btc))))
kf_gold <- KFS(fit_gold$model, smoothing = c("state"))
kf_btc <- KFS(fit_btc$model, smoothing = c("state"))

# Step 3: Applying high-pass filter to mitigate low-frequency drift
hp_gold <- kf_gold$alphahat - zoo::rollmean(kf_gold$alphahat, k=30, fill=NA, align="right")
hp_btc <- kf_btc$alphahat - zoo::rollmean(kf_btc$alphahat, k=30, fill=NA, align="right")

# Step 4: Normalization of filtered trends into a common scale
gold_norm <- scales::rescale(hp_gold, to = c(0, 100))
btc_norm <- scales::rescale(hp_btc, to = c(0, 100))

# Final visualization to compare trends
ggplot() +
  geom_line(aes(x = gold$date, y = gold_norm, color = "Gold"), linewidth = 1.2) +
  geom_line(aes(x = btc$date, y = btc_norm, color = "Bitcoin"), linewidth = 1.2) +
  labs(title = "Gold vs Bitcoin: Filtered High-Pass Trends", x = "", y = "Normalized Trend")
Implications and Future Outlook
What this means for you as an investor or analyst is significant. The adaptation of the Kalman filtering pipeline for financial analysis has profound implications for how we monitor and manage investments. Rather than relying solely on historical price trends, this method allows for a deeper understanding of market movements, painting a truer picture of asset interrelations. For professionals in finance, familiarizing yourself with these methodologies might just give you an edge in a competitive market.
The integration of advanced analytical methods into financial analysis is poised to revolutionize asset management strategies. This trend underscores a broader movement towards data-based decision-making in finance, where precision and adaptability can yield substantial benefits. As algorithms become more sophisticated and accessible, it’s likely we’ll see even more complex comparisons draw on realms previously viewed as unrelated. The next few years could witness even deeper dives into multifaceted asset evaluations.
Final Thoughts
The adaptation of the Kalman filtering pipeline for financial analysis illustrates the potential for cross-disciplinary techniques to yield valuable insights. By ensuring that the analysis is systematic and reproducible, this approach not only enhances our understanding of asset movements but also sets the groundwork for future explorations into other financial comparisons and evaluations. As these methodologies gain traction, they can reshape investment strategies and risk assessments, aligning them more closely with reality.
Discussion
Sign in to join the discussion.