June 2026 brought 412 new R packages to CRAN, enhancing data analysis in fields like biology and environmental science with specialized tools.
The Rise of New CRAN Packages in June 2026
June 2026 saw a remarkable influx of innovation in the R programming community, with 412 new packages uploaded to the Comprehensive R Archive Network (CRAN). What stands out about this release is not just the volume but the diversity of fields these packages aim to serve, spanning a tantalizing breadth of disciplines from Bioarchaeology to Financial Analytics. For those of you working in the data science or ecological sectors, this new batch could offer some potent tools. I've sifted through the 412 entries and picked the Top 40 packages, which I believe could have a significant impact across various domains such as Biology, Epidemiology, Machine Learning, and Climate Studies. Each package is carefully crafted to address specific challenges within its niche. For instance, the new Bioarchaeology package, baytaAAR, introduces Bayesian age estimation methods tailored for skeletal data. Utilizing advanced ordinal probit regression models fromJAGS and NIMBLE, it enhances our understanding of ancient populations by addressing estimation uncertainties effectively.
Similarly, in the realm of Environmental Science, the clim4health package offers crucial functions for managing climate data, crucial for epidemiological studies, which is particularly timely given the current climate challenges we face. By facilitating the transformation and exportation of climate datasets, it arms researchers with the tools needed to tackle pressing public health issues.
Yet, it’s not just about these high-caliber packages; you’ll also find others that appeal to niche interests, such as power.nb, geared towards accurately estimating statistical power in microbiome studies. With advances like these, there's a clear signal that the R community continues to evolve, making room for increasingly specialized analytical needs.
The insights and capabilities these packages offer represent much more than mere additions to CRAN. They signal a commitment to precision in analysis, problem-solving in real-world applications, and an enduring drive to push the boundaries of what we can achieve within R. As you explore these new tools, consider how they may enhance your own work and whether they might introduce efficiencies in your analytical processes.Functional Data Analysis
The recent release of the fda.vi package, now at version 1.0.0, introduces a variational Expectation-Maximization algorithm that significantly enhances the smoothing of both single and multi-dimensional functional observations. What sets this package apart is its ability to handle within-curve correlations efficiently while estimating all model parameters simultaneously. This feature not only boosts accuracy but also streamlines the entire analytical workflow, making it ideal for researchers needing flexible solutions for correlated functional data. For a deeper dive into the algorithm, check out the research presented by da Cruz et al. (2024), and for practical examples, refer to the vignette.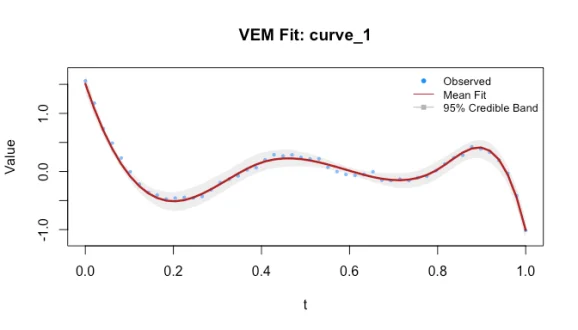
Machine Learning
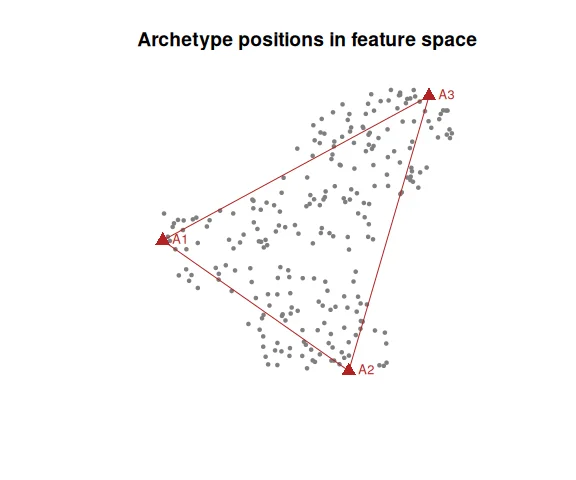
The svmodt package version 0.1.0 marks a notable advancement in classification methodologies. This package employs Support Vector Machine Oblique Decision Trees, which leverage linear Support Vector Machine hyperplanes for tree construction rather than traditional axis-parallel splits. This results in more nuanced decision boundaries that can better handle complex data patterns. With integrated features for dynamic subset selection, class weight adjustments for imbalanced datasets, pruning, and penalization options, it offers a robust toolkit for machine learning practitioners. For a comprehensive overview, the vignette is a great resource to explore.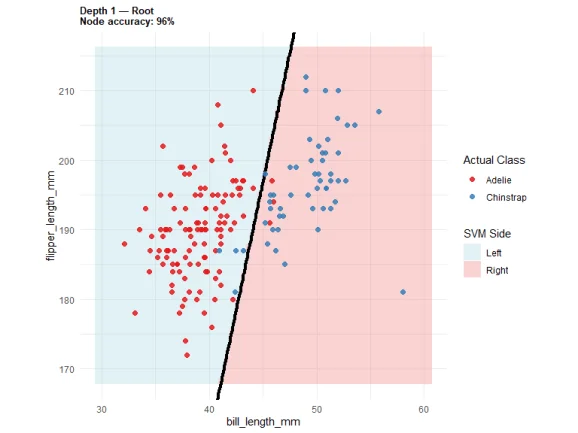 The yaap package, now at version 1.0.0, introduces a variety of archetypal analysis models—ranging from classical to advanced probabilistic approaches. This tool adapts methods from significant works like Cutler and Breiman (1994) and Mørup and Hansen (2012), as well as newer contributions like Olsen et al. (2022). The package also includes various initialization techniques and diagnostic tools that underpin its versatility. If you're curious about applying these methods, check out the four available vignettes, including a focused introduction and one that deals with Tidymodels Workflows.
Medical Statistics
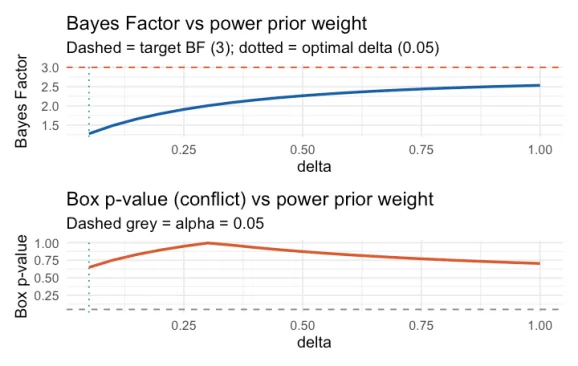
The introduction of BayesTSM version 1.0.1 offers a sophisticated way to model disease progression in screening programs through a Bayesian framework. Targeting the understanding of three distinct disease states—healthy, pre-state disease, and disease state—this package is essential when contemplating interventions that might halt disease advancement. Its model can accurately estimate transitions between states even under censoring, thereby providing clinicians with crucial insights. For a more detailed explanation of its methodology, refer to the work of Klausch et al. (2023), and explore practical applications by reviewing the vignette.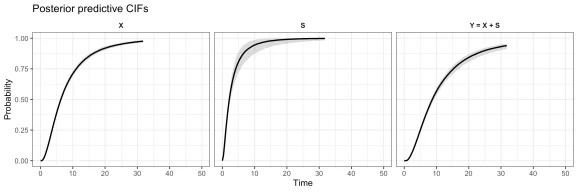 The bayprior package at version 0.2.12 serves as a critical resource for constructing and validating Bayesian priors in clinical trials. Highlighting methods like quantile matching and moment matching, it provides researchers with a versatile toolkit for both expert elicitation and prior-data conflict diagnostics. Notably, its modular
 Shiny application allows for interactive exploration, making the statistical process more accessible. To enrich your understanding, delve into resources from Box (1980) and Oakley and O’Hagan (2010). The package offers six vignettes, including essential introductions and comprehensive explorations of robust priors.
Discussion
Sign in to join the discussion.